

Carpets & Other Textile Floor Coverings — HS Chapter 57
Period Covered: April 2025 – March 2026 (Provisional) | Source: Department of Commerce Trade Portal
1. Overall Export Performance
1.1 Export Value (USD)
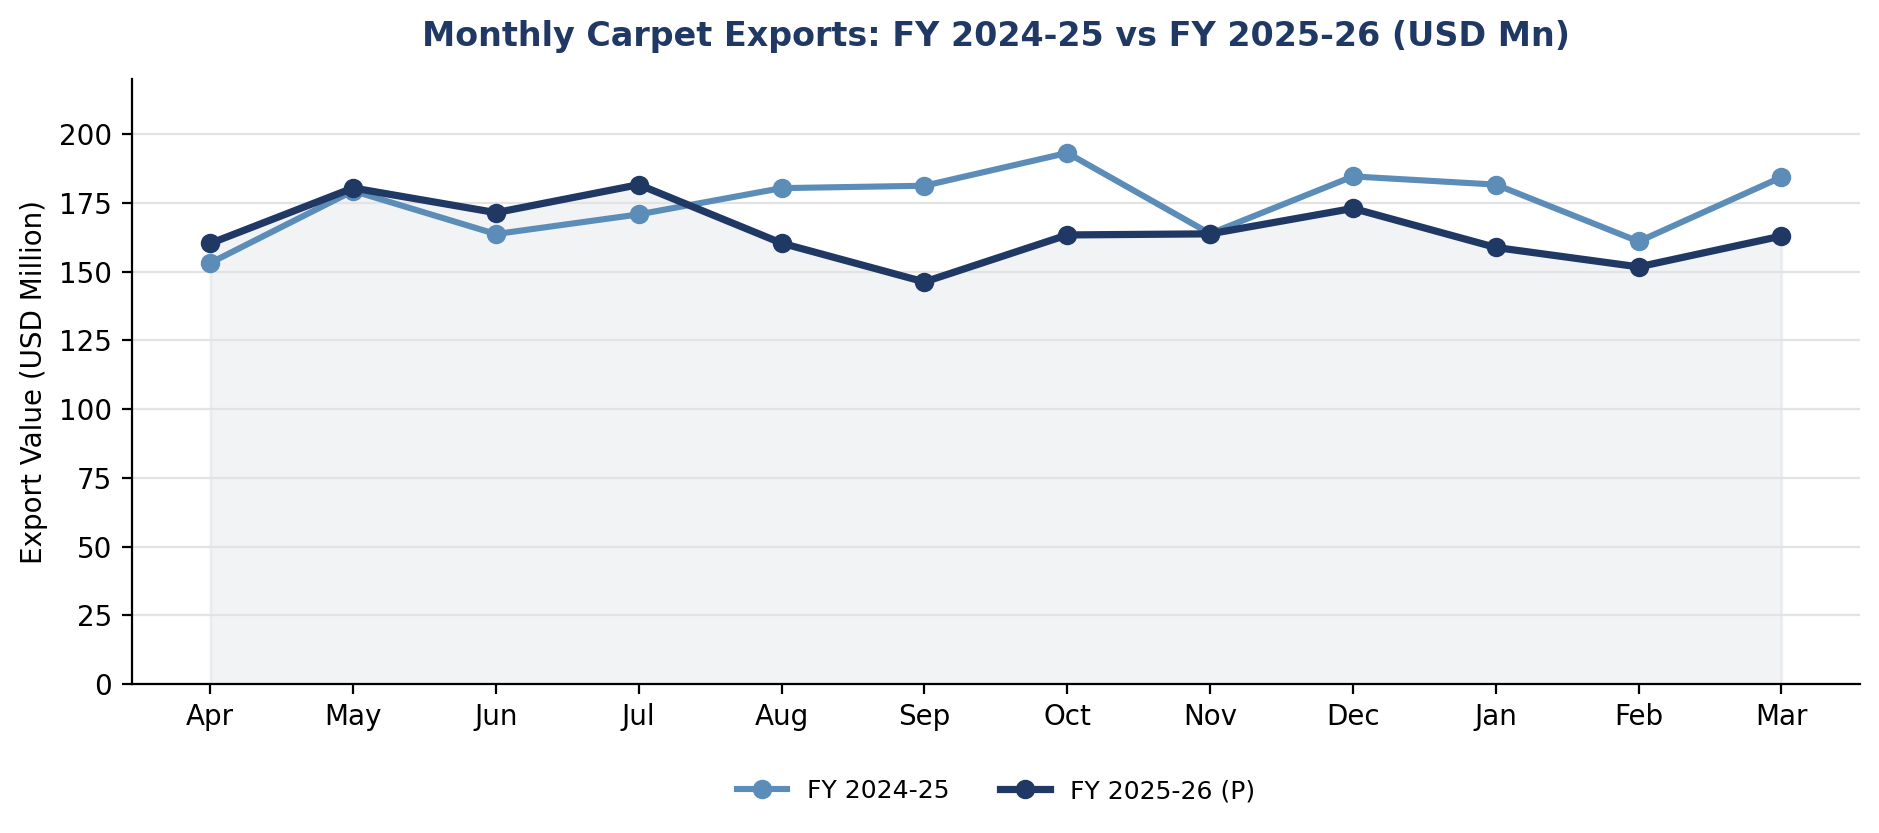
- Cumulative exports during April 2025–March 2026 (P), the full financial year under review, reached USD 1,973.99 million, compared with USD 2,097.34 million in FY 2024-25, reflecting a de-growth of 5.84% (YoY).
- In Rs. Crore terms, FY 2025-26 (P) exports stood at Rs. 17,427.26 crore, against Rs. 17,732.52 crore in FY 2024-25, a decline of 1.72%.
- For the final month of the year, exports during March 2026 (P) stood at USD 162.94 million, against USD 184.37 million in March 2025 — a decline of 11.62% (YoY).
1.2 Comparative Analysis
| Comparison | Performance (US$ Mn terms) | Performance (Rs. Crores terms) |
|---|---|---|
| FY 2025-26 (P) vs FY 2024-25 | ▼ 5.84% | ▼ 1.72% |
| March 2026 vs March 2025 | ▼ 11.62% | ▼ 5.39% |
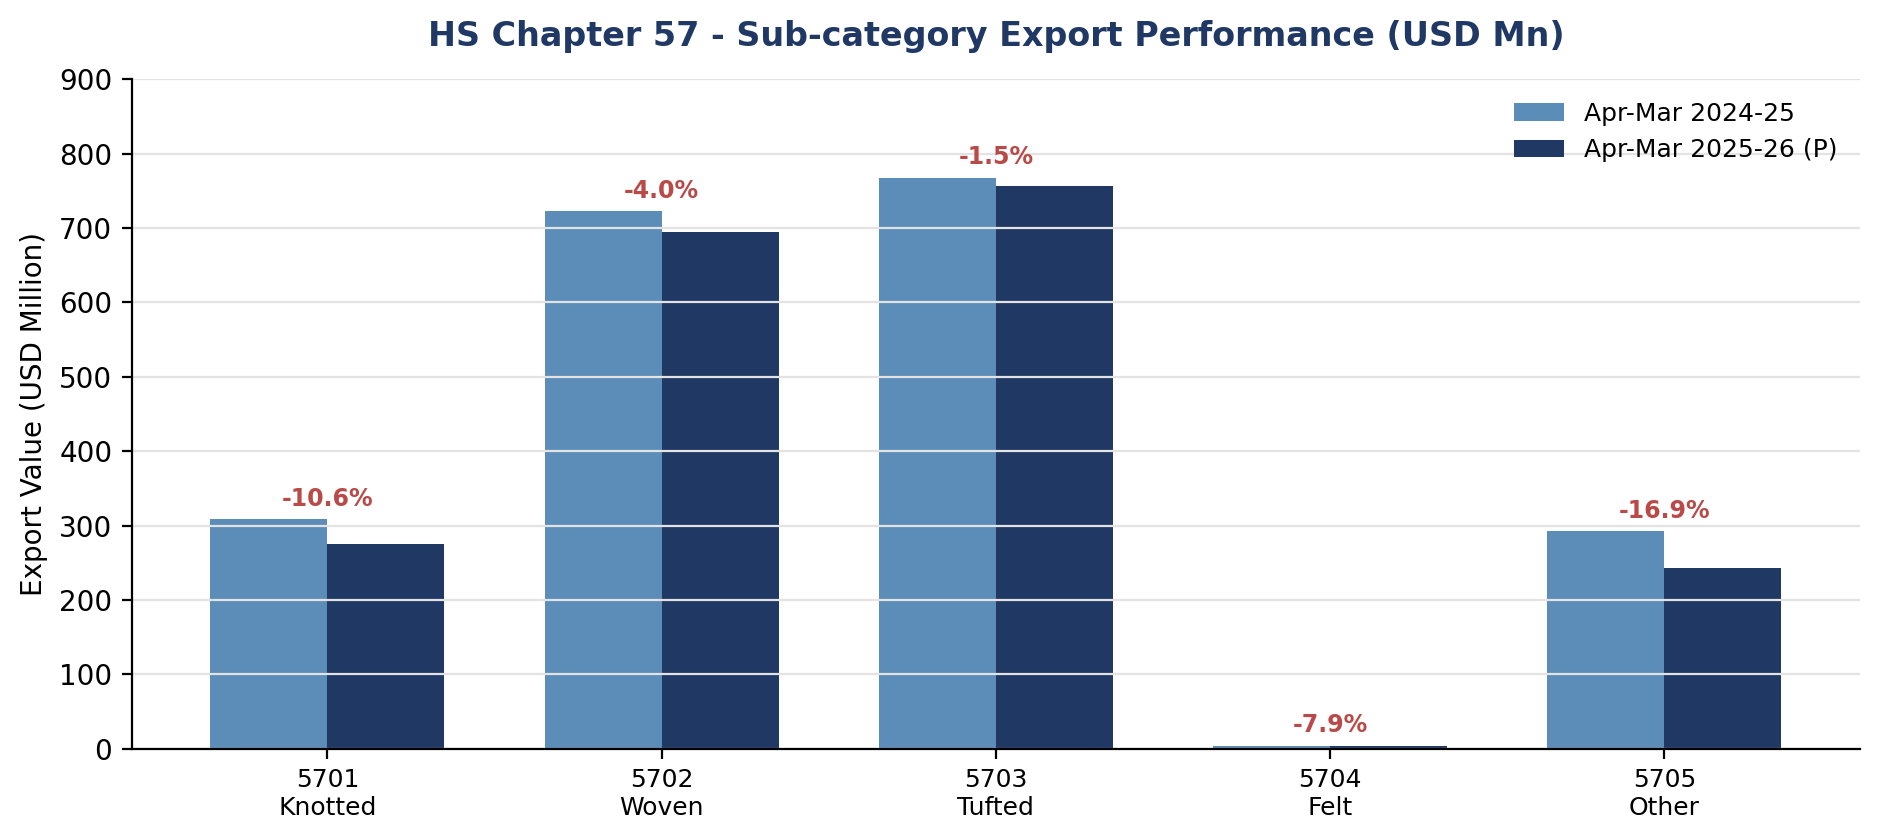
1.2.1 Product Category (HS Code) Performance — Values in US $ Million
| HSN | Description | Apr-Mar ’24-25 | Apr-Mar ’25-26 (P) | % Growth |
|---|---|---|---|---|
| 5701 | Carpets & Floor Coverings, Knotted | 308.63 | 275.94 | -10.59% |
| 5702 | Woven, Not Tufted/Flocked | 723.03 | 694.42 | -3.96% |
| 5703 | Tufted | 767.77 | 756.41 | -1.48% |
| 5704 | Of Felt, Not Tufted/Flocked | 4.19 | 3.86 | -7.88% |
| 5705 | Other Carpets & Floor Coverings | 292.75 | 243.36 | -16.87% |
| Grand Total | 2096.37 | 1973.99 | -5.84% |
1.2.2 Product Category (HS Code) Performance — Values in Rs. Crore
| HSN | Description | Mar ’25 | Mar ’26 (P) | % Growth | Apr-Mar ’24-25 | Apr-Mar ’25-26 (P) | % Growth |
|---|---|---|---|---|---|---|---|
| 5701 | Carpets & Floor Coverings, Knotted | 268.38 | 235.08 | -12.41% | 2,612.06 | 2,438.03 | -6.66% |
| 5702 | Woven, Not Tufted/Flocked | 527.08 | 580.35 | 10.11% | 6,115.99 | 6,138.51 | 0.37% |
| 5703 | Tufted | 606.67 | 525.00 | -13.46% | 6,493.33 | 6,669.14 | 2.71% |
| 5704 | Of Felt, Not Tufted/Flocked | 2.74 | 2.22 | -18.98% | 35.83 | 34.26 | -4.38% |
| 5705 | Other Carpets & Floor Coverings | 192.74 | 168.85 | -12.39% | 2,475.31 | 2,147.32 | -13.25% |
| Grand Total | 1,597.61 | 1,511.50 | -5.39% | 17,732.52 | 17,427.26 | -1.72% |
1.3 Trend & Seasonal Commentary
- March 2026 reflected a comparatively weaker performance for India’s carpet exports, with overall exports declining on both a monthly and cumulative basis compared to the previous year.
- Export performance during March was impacted by continued geopolitical tensions and Red Sea shipping disruptions, which increased freight costs and transit uncertainty for exporters.
- HS 5702 remained the only major category to record positive growth during March 2026, indicating relatively stable demand for woven textile floor coverings in international markets.
2. Key Market / Country-wise Analysis
2.1 Leading Export Markets (Apr–Mar 2026)
| Rank | Country | Export Value (USD Mn) |
|---|---|---|
| 1 | USA | 1,096.92 |
| 2 | UK | 113.79 |
| 3 | Germany | 86.41 |
| 4 | Australia | 86.11 |
| 5 | U.A.E. | 60.43 |
| 6 | Netherland | 54.42 |
| 7 | Sweden | 52.02 |
| 8 | France | 45.13 |
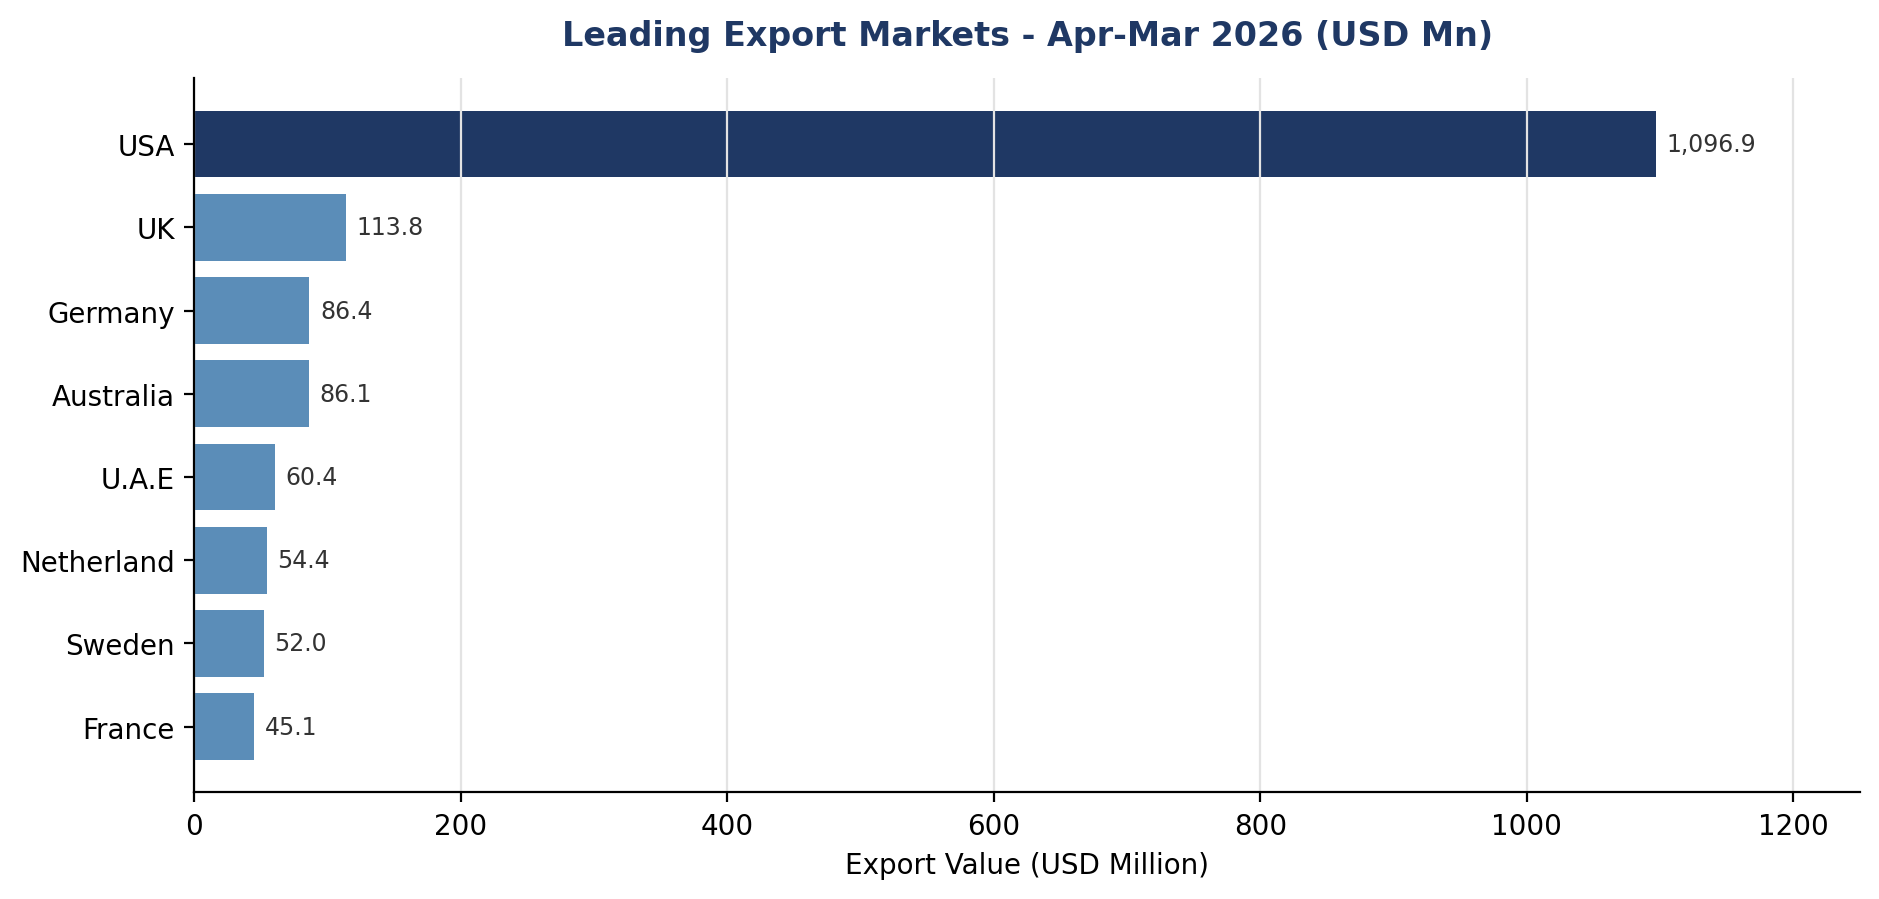
- The USA continued to dominate India’s carpet exports during Apr–Mar 2026, accounting for the largest share of total exports and highlighting its importance as the primary export destination.
- European countries such as the UK, Germany, the Netherlands, Sweden, and France remained among the top export markets, indicating stable demand for Indian carpets across the European region.
- The export pattern also indicates continued dependence on a limited number of major markets, particularly the USA and Europe, for overall export performance.
2.2 India’s Carpet Exports to the USA — Month-wise Performance
| Month | Value 2024-25 | Monthly Growth % | Value 2025-26 | Monthly Growth % | YoY Growth % |
|---|---|---|---|---|---|
| April | 88.55 | — | 91.70 | — | 3.56% |
| May | 104.83 | 18.39% | 105.60 | 15.16% | 0.73% |
| June | 95.19 | -9.20% | 101.48 | -3.90% | 6.61% |
| July | 99.60 | 4.63% | 104.28 | 2.76% | 4.70% |
| August | 104.77 | 5.19% | 86.33 | -17.21% | -17.60% |
| September | 104.82 | 0.05% | 71.23 | -17.49% | -32.05% |
| October | 112.88 | 7.69% | 87.97 | -23.50% | -22.07% |
| November | 95.00 | -15.84% | 86.53 | -1.64% | -8.92% |
| December | 108.68 | 14.40% | 96.05 | 11.00% | -11.62% |
| January | 181.74 | 67.22% | 158.79 | 65.32% | -12.63% |
| February | 95.06 | -47.69% | 71.37 | -55.05% | -24.92% |
| March | 184.45 | 94.04% | 162.96 | 128.33% | -11.65% |
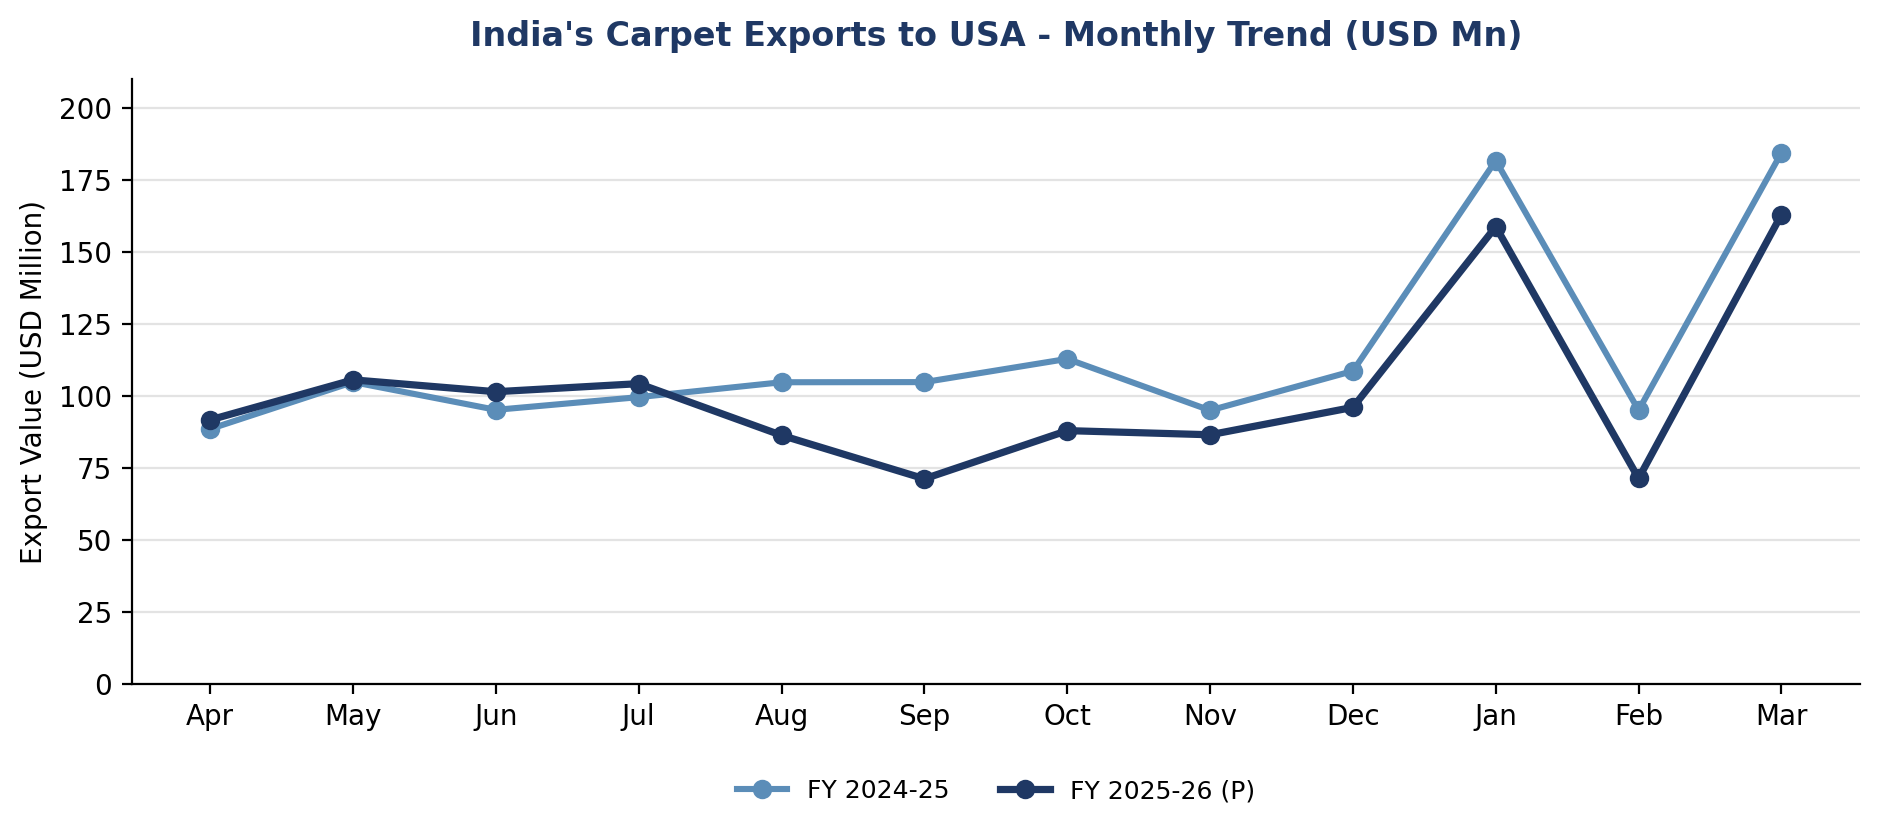
Value-wise Interpretation:
- March 2026 recorded a strong month-on-month recovery in exports to the USA compared to February, indicating revival in shipment activity and improvement in order execution towards the end of the financial year.
- The significant rise in March exports suggests that buyers resumed procurement after weaker imports during February, possibly due to replenishment of inventories and delayed shipment clearances.
- The negative YoY growth trend indicates that overall demand conditions in the USA remained cautious due to inflationary pressure, slower housing activity, and softer retail demand in home furnishing products.
2.3 Emerging / High-Potential Markets
- Sweden, Poland and Russia showed positive movement on a Y-o-Y basis, supported by improved order flow and volume growth.
- Rest of the World (approx. USD 260 million) indicates scope for market diversification.
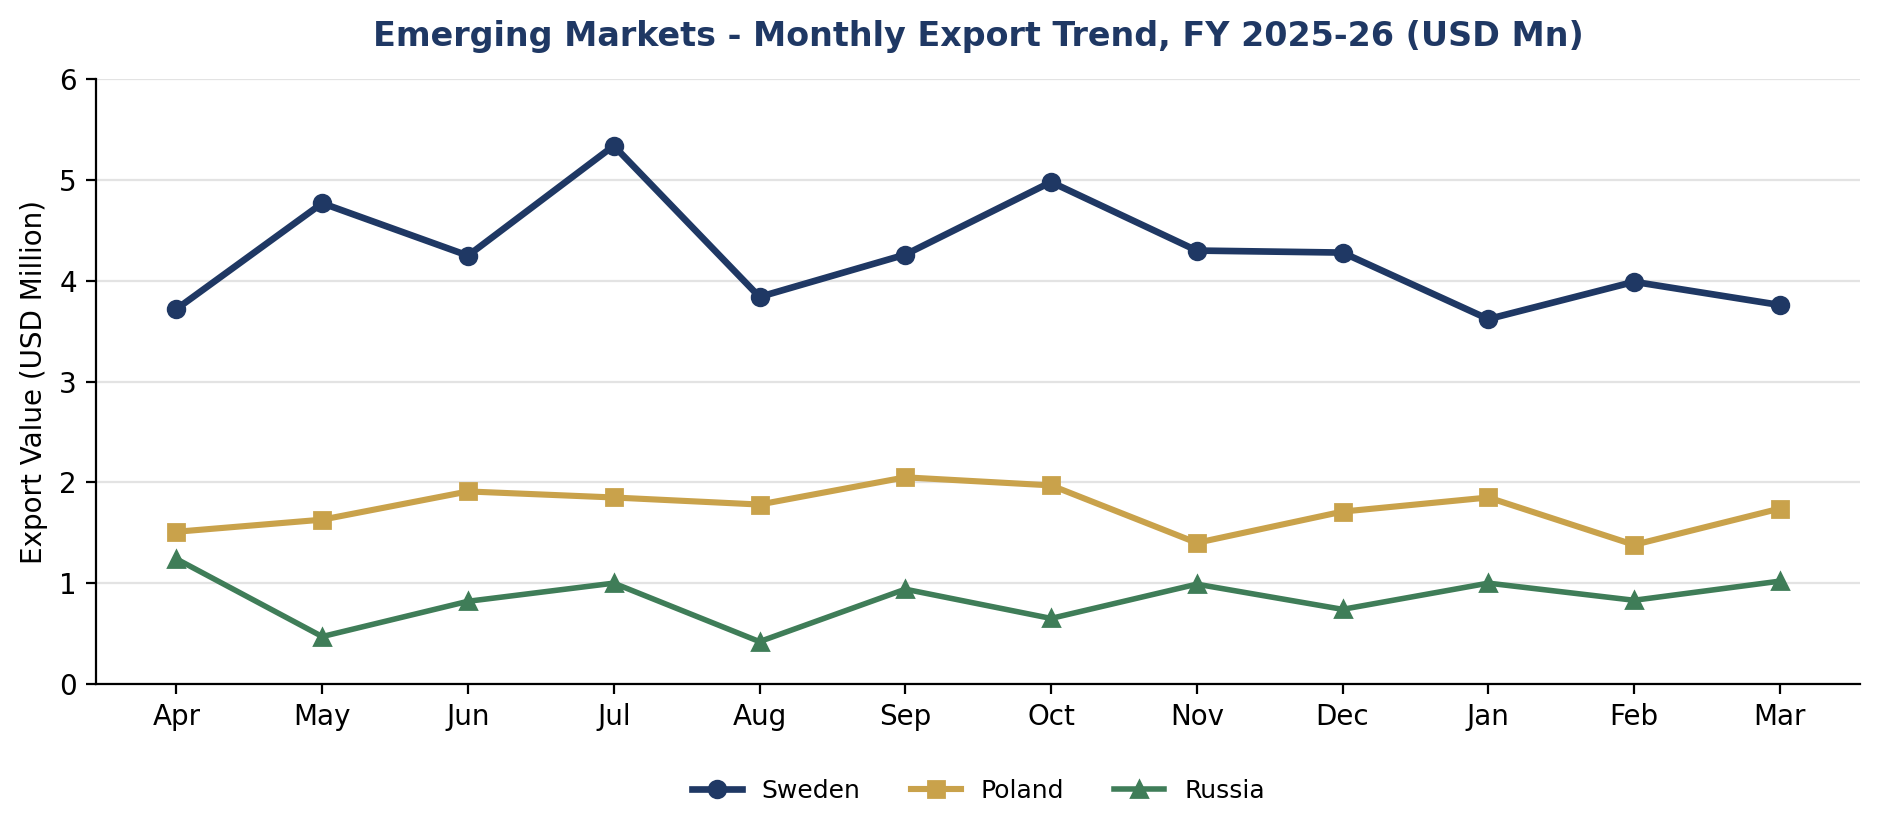
Sweden ended FY 2025-26 with March exports of USD 3.76 million (+17.13% YoY); Poland recorded a strong March recovery to USD 1.74 million (+26.09% MoM); and Russia posted USD 1.02 million in March, up 22.89% MoM and 9.68% YoY — together underscoring the diversification opportunity beyond the USA and core EU markets.
3. Market-specific Insights
3.1 Sweden
- Sweden remains one of the most stable and high-value Nordic markets for Indian carpet exports under Chapter 57.
- Swedish consumers show strong preference for sustainable, eco-friendly, handmade, and natural-fibre carpets, aligning well with India’s product strengths.
- Demand is supported by premium residential projects, interior design firms, and the hospitality sector, which favour handcrafted products with unique designs.
- Sweden can serve as a strategic market for expanding Indian carpet exports across the wider Nordic region due to similarities in consumer preferences.
3.2 Poland
- Poland is emerging as a growing gateway market in Central and Eastern Europe for Indian carpet exports.
- Polish consumers are increasingly seeking value-for-money handmade and hand-tufted products, where Indian manufacturers enjoy a competitive advantage.
- The market offers opportunities for mid-range and contemporary designs, particularly in machine-assisted handmade categories under Chapter 57.
- The strong 26.09% month-on-month growth in March 2026 reflects renewed demand from distributors and retailers ahead of the spring and summer furnishing season.
3.3 Russia
- Russia emerged as a steadily growing market for Indian carpets, supported by rising demand for affordable handmade and decorative floor coverings.
- Positive YoY growth in several months reflects improving trade engagement and stable buyer demand despite geopolitical challenges.
- Demand remained relatively resilient in urban retail and residential furnishing segments, particularly for mid-range handmade carpets.
- Russia continues to offer diversification opportunities for Indian carpet exporters beyond traditional US and EU markets.
4. Cluster-wise Export Performance — Chapter 57
Values in INR Crore.
| Cluster / State | HS 5701 | HS 5702 | HS 5703 | HS 5704 | HS 5705 | Grand Total |
|---|---|---|---|---|---|---|
| Panipat (Haryana) | 96.83 | 3,271.81 | 2,600.15 | 2.52 | 894.33 | 6,865.64 |
| Bhadohi, Mirzapur, Varanasi, Agra (UP) | 1,809.74 | 2,003.54 | 1,679.50 | 0.47 | 699.92 | 6,193.17 |
| Jaipur, Bikaner (Rajasthan) | 390.52 | 210.39 | 27.46 | 0.19 | 59.68 | 688.24 |
| Rest | 140.94 | 650.79 | 2,166.02 | 31.11 | 462.50 | 3,451.36 |
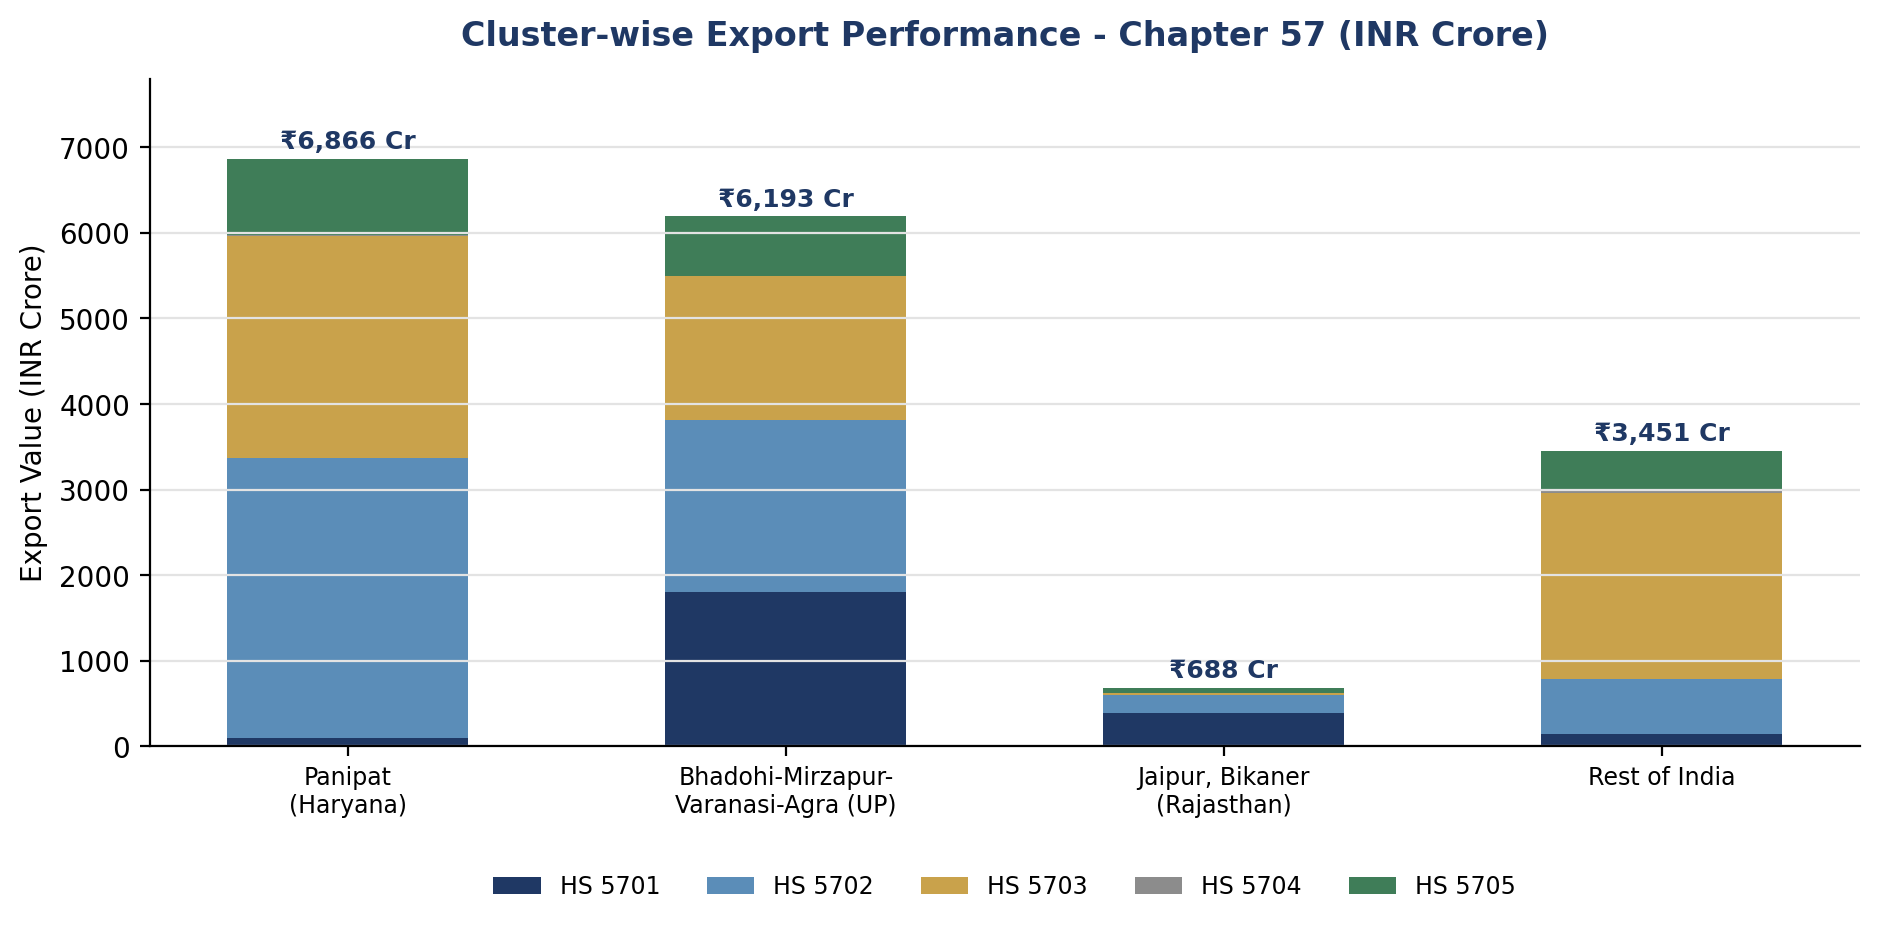
- Panipat (Haryana) is the largest exporting cluster with ₹6,865.64 crore, contributing the highest share of Chapter 57 exports.
- The Bhadohi–Mirzapur–Varanasi–Agra belt (Uttar Pradesh) leads in HS 5702, reinforcing its position as a major handmade carpet hub.
- HS codes 5702 and 5703 dominate exports across all clusters, especially in Panipat and the Uttar Pradesh belt.
- Overall exports remain highly concentrated in two major clusters (Panipat and the UP belt), indicating regional dependency of the industry.